


Sevens stats: How Fiji won the 2014-15 series
As the 2015-16 HSBC World Rugby Sevens Series gets ready for kick-off in Dubai, we look back at last season through a statistician’s lens, unearthing a number of intriguing trends and ‘did you knows’ along the way.
ATTACK, ATTACK, ATTACK
Just when you thought sevens couldn’t get any better, it did. The average number of tries and points scored per game in 2014-15 was higher than in the previous three seasons, with 5.8 tries (compared to 5.2 in 2013-14) and 36.4 points (33 in 2013-14).
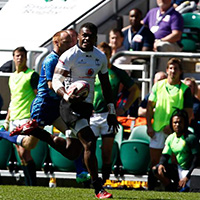
FIJI FLY THE FLAG
Fijian flair was to the fore again in 2014-15, resulting in Ben Ryan’s side scoring more tries on average than any other team at 4.5 tries per match, or one every 44 seconds of possession – that’s 29 seconds quicker than the series average. The two other ‘sub one-minute’ teams were South Africa and New Zealand.
POOL PARTY
To win the world series title without losing a single match in pool play is testament to the consistency that has been added to Fiji’s unquestionable natural ability by Ben Ryan, and his assistants.
HIGH FIVES
With 10 penalty goals and a conversion success rate of 65 per cent, it was inevitable that tries would determine the winning team in the vast majority of cases – and this proved to be the case. Of the 405 matches, 352 (or 87%) were won by the team scoring the most tries, while in 53 (or 13%) of matches tries were equal. In those 53 matches, 50 were won by the team that scored the more conversions, three matches were won through a penalty goal and there were nine draws.
CONVERSIONS GO SOUTH
While the winning margins between teams are getting tighter and tighter (down to an average of 18) who knows what impact all the two-pointers missed by the southern hemisphere’s ‘big three’ would have had on the overall series standings. Remarkably, series runners-up South Africa, third-place New Zealand and fifth-place Australia all scored below average when it came to conversion success rates, suggesting they score a lot out wide. With 64%, the Blitzboks were a fraction below the average of 65%, while New Zealand and Australia will be looking for a significant improvement on their return of 58 and 57% respectively. Argentina set the benchmark in 2014-15 with a series best of 75%.
PENALTIES WINS PRIZES
A reduced penalty count was one of the factors behind Fiji’s first series title success since 2005-06. They conceded an average of just 3.1 penalty/free-kicks per match in 2014-15, compared to 3.8 in 2013-14. Best in this respect were Kenya with 2.5 pens/free kicks conceded per game. When you consider that most tries conceded come from infringements (32%) this was a vital area for Fiji to make an improvement in. Scotland were the most clinical in this respect with 42% of their tries coming immediately after the referee had blown his whistle.
TURNOVER MAPLE LEAFS
Among the core teams, Canada were the kings when it came to converting turnovers into tries with 31% of their five-pointers deriving from this valuable source of possession.
RE-START RECKONING
A fifth of all tries come from re-starts which is still the most frequent form of set-piece in the game of sevens, with 6.8 restarts on average in a match. Overall, of all contestable restarts, the kicking team regained one in three restarts
PHASE PLAY PHASED OUT
Fiji don’t do patient build-ups. Eighty-two per cent of their tries were scored with no ruck or maul in the move leading up a try being scored – 13% higher than the next team. In 67% of cases, three passes or fewer were made by Fiji in scoring a try – only South Africa (74%) were more clinical in that respect.
RUNNING FROM DEEP
France’s ambition to attack from anywhere is illustrated by the fact that over half of their tries (54%) originated from inside their own half – a throw-back to the good old days of French flair.
SERIES SINNERS
Samoa received 16 yellow cards throughout the series putting them top of the sin-bin league. Given their low penalty count Fiji were surprisingly the joint second worst offenders in this respect along with South Africa with 13 cards collected. Overall, there was a big rise in the number of yellow cards being shown – up from 93 in 2011-12 to 142 last season.
KEEP BALL
New Zealand’s combativeness at the breakdown perhaps helps to explain why they had possession of the ball longer than any other team on the series – three minutes and 54 seconds (54%). Sir Gordon Tietjens’ team were masters of the ruck, enjoying joint-top position with Australia in terms of rucks won with 84%. It’s not always how long you have the ball though, it is what you do with it. Fiji, for example, only averaged three minutes 15 seconds of possession, putting them 15th in that category. While their ball retention rate at the ruck and maul (79%) was lower than title rivals South Africa and New Zealand, it was a significantly higher than the 73% they managed the previous year.
PASS MASTERS
Japan had the highest passing rate 5.6 (passes per minute of possession) of any of the core teams while South Africa has the lowest with 7.8.
IN SUMMARY … FIVE THINGS WE LEARNT:
The team that scores the most tries wins the match in the vast majority of cases (87%)
The series is getting tighter – nearly a quarter of all matches were settled by margins of five points or less
Penalties and free-kicks are the most profitable source of tries
More players are getting yellow-carded
Re-starts are still the dominant form of set-piece
(Source: http://www.worldrugby.org)